Frame 5 --- cells at time t = 0.15000
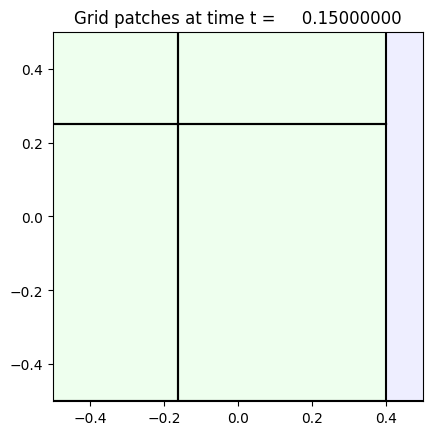
Image source: /Users/rjl/clawpack_src/clawpack_master/geoclaw/examples/multi-layer/plane_wave/_plots/frame0005fig2.png
Other figures at this time: Surface speed cells All Figures
Other frames: 0 1 2 3 4 5 6 7 8 9 10 All Frames