Frame 3 at time t = 5.40000e+03
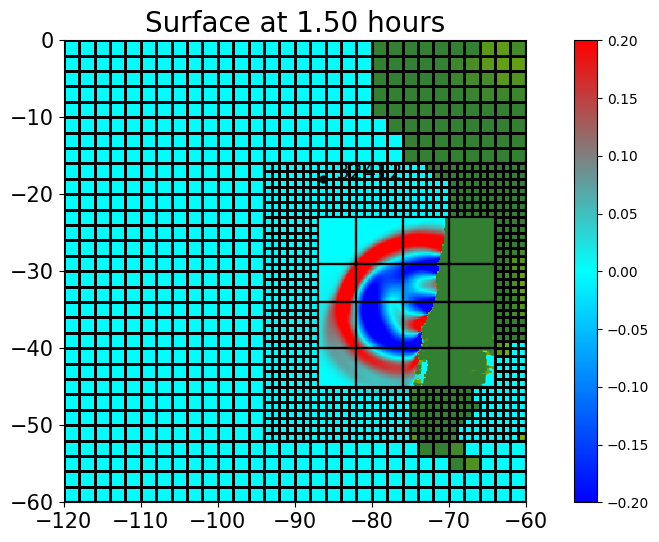
Image source: /Users/rjl/clawpack_src/clawpack_master/geoclaw/examples/tsunami/chile2010/_plots/frame0003fig0.png
Other frames: 0 1 2 3 4 5 6 7 8 9 10 11 12 13 14 15 16 17 18 All Frames
Image source: /Users/rjl/clawpack_src/clawpack_master/geoclaw/examples/tsunami/chile2010/_plots/frame0003fig0.png
Other frames: 0 1 2 3 4 5 6 7 8 9 10 11 12 13 14 15 16 17 18 All Frames