Frame 4 --- Scatter plot of h at time t = 1.00000
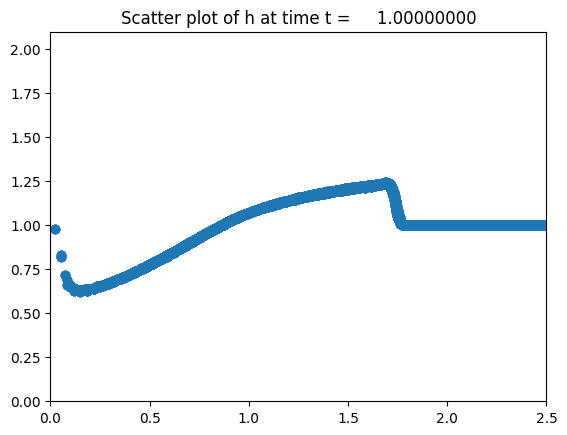
Image source: /Users/rjl/Downloads/clawpack-v5.10.0pyclaw/pyclaw/examples/shallow_2d/_plots/frame0004fig1.png
Other figures at this time: Water height Scatter plot of h All Figures
Other frames: 0 1 2 3 4 5 6 7 8 9 10 All Frames